Analytics
Analytics overview
Read PageDuel's traffic, engagement, conversion, and revenue metrics.
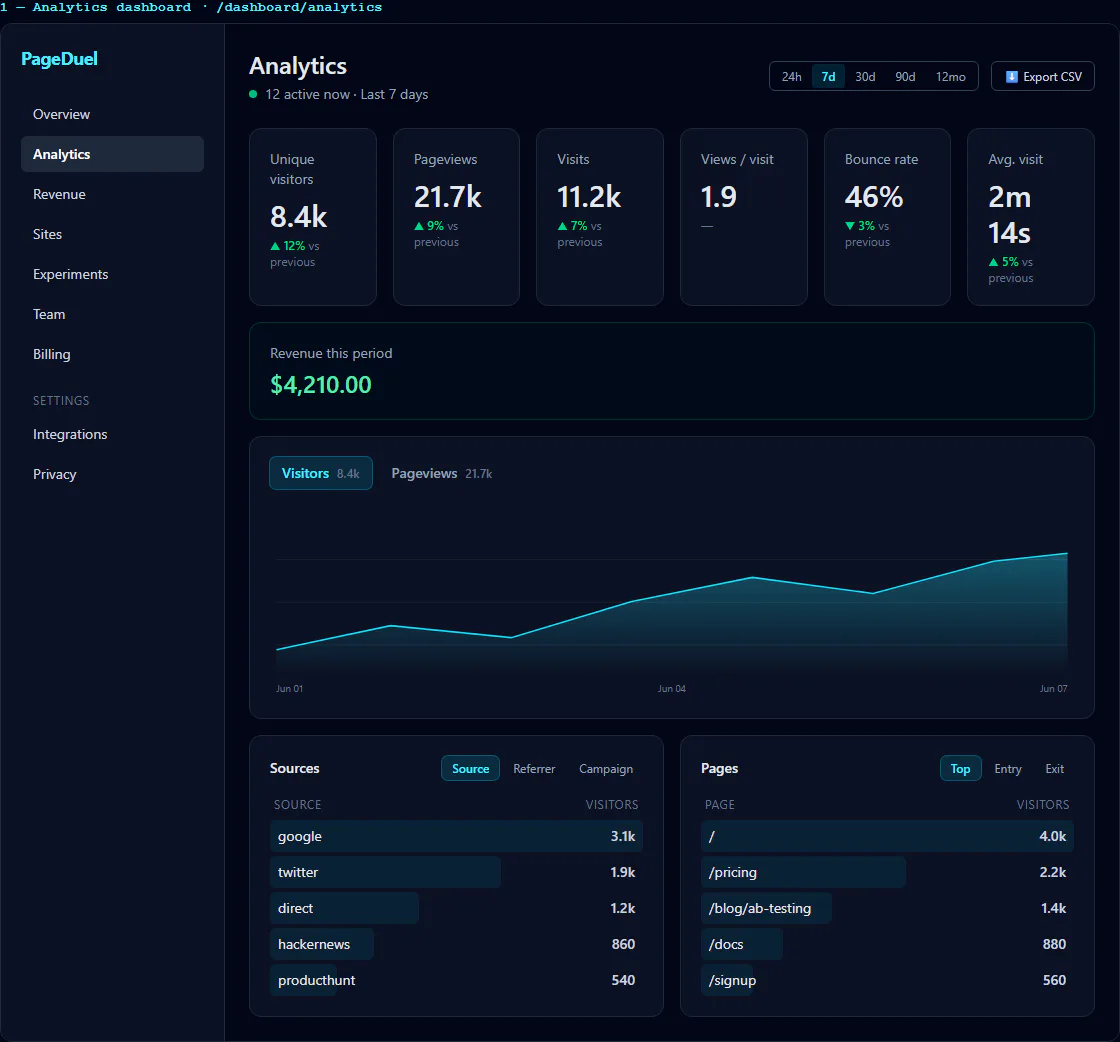
The analytics overview shows unique visitors, visits, pageviews, views per visit, bounce rate, visit duration, revenue, revenue per visitor, and conversion rate. Select a KPI to chart it over time and compare it with the preceding period.
Use one-site scope for detailed breakdowns. All-sites scope pools organization performance and adds comparison cards. Large date ranges may show a sampling notice; treat sampled figures as directional and shorten the range when you need exact detail.